Why D3.js is So Great for Data Visualization
TL;DR
D3.js revolutionized data visualization by working seamlessly in web browsers without plugins, offering unprecedented flexibility through direct DOM manipulation and integration with HTML, CSS, and SVG standards.
- Why it matters: D3 bridges data and graphics perfectly, enabling creative visualizations that live anywhere on the web without technical barriers.
- The big picture: Released in 2011, D3 succeeded where predecessors failed by embracing open web standards and browser evolution.
- How it works: Manipulates any part of the document object model, leveraging built-in browser functionality for mouse interactions and rendering.
- Reality check: DOM manipulation becomes slow with large datasets, and SVG has performance limits with numerous elements.
- The bottom line: D3 isn't a graphics or data processing library but the essential connector between data and visual representation.
When D3 came out in 2011, it became clear pretty quickly that it was going to be a powerful tool for creating data visualizations. But it’s certainly not the first — or only — tool. Why did it succeed when so many other libraries have failed?

First of all, it works on the web. Data visualizations are only good if people see them, and there’s no better place to see them than on the internet, in your browser. Protovis was the first library to make any real headway in this direction, despite other libraries and services that tried.
First of all, it works on the web. Data visualizations are only good if people see them, and there’s no better place to see them than on the internet, in your browser. Protovis was the first library to make any real headway in this direction, despite other libraries and services that tried. Manyeyes is cool, but it lacks graphic flexibility and the resulting visualizations can’t just live anywhere seamlessly. Prefuse and Flare (both predecessors to D3) are nice, but neither one runs in a browser without a plugin. Quadrigram (previously Impure) has the same plugin problem. 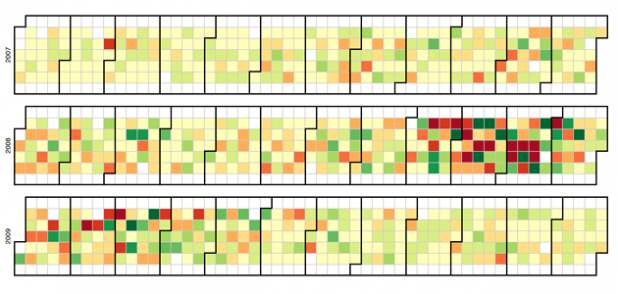
Another reason it has worked so well is because of its flexibility. Since it works seamlessly with existing web technologies, and can manipulate any part of the document object model, it is as flexible as the client side web technology stack (HTML, CSS, SVG). This gives it huge advantages over other tools because it can look like anything you want, and it isn’t limited to small regions of a webpage like Processing.js, Paper.js, Raphael.js, or other canvas or SVG-only based libraries. It also takes advantage of built in functionality that the browser has, simplifying the developer’s job, especially for mouse interaction.
If you poke around recent projects built on D3, especially the ones that popped up around 2023 and 2024, you’ll notice people aren’t just making pie charts and scatterplots. There’s a sort of wild experimentation—things that live somewhere between art and data. Take a look at the interactive stories from Reuters or The New York Times if you want to see D3 in the wild, quietly carrying most of the heavy lifting. And, even if you don’t know the library inside out, there’s something oddly satisfying about picking apart those examples and realizing just how tightly the visuals and the underlying data are woven together. It’s not just for tech demos—it’s become part of the language of digital storytelling.
D3 also gained this almost grassroots momentum from educators. Professors and data viz enthusiasts adopted it as a teaching tool, not simply because it’s the flashiest, but because it forced students to really grapple with what happens when you bind data to shapes. You can spot D3 exercises in more than a dozen university curriculums, and someone’s always tossing a recent example on GitHub or Observable. There’s a sort of contagious feeling—once you see the first simple transition, you want to keep tweaking, fiddling. That energy’s hard to manufacture, yet D3 sort of fosters it naturally.
All of these features have been timed perfectly to coincide with the rise of new browsers and a push towards documents created using open standards rather than relatively walled-in plugins. The death of Internet Explorer as the top browser plays no small role in this, and the rendering and javascript engines in other browsers have made huge strides with their newfound attention. Some of this momentum has carried over to D3 as a way to take advantage of the new features and technology buzz.

But snazzy new technologies that work seamlessly aren’t the only reason that D3 has become successful. Great documentation, examples, community, and the accessibility of Mike Bostock have all played major roles in its rise to prominence. Without these components, D3 would likely have taken much longer to catch on.

So how about D3’s disadvantages? DOM manipulation can be extremely slow for large numbers of entries. SVG also has performance limitations when dealing with large quantities of elements. Fortunately for D3, good data visualization rarely requires drawing these quantities of elements on the screen. There is a learning curve to javascript, but this is true of all tools, and with great community support, learning is much easier.

Perhaps the most important part of D3’s success is the position and approach it takes. It is not a graphics library, nor is it a data processing library. It doesn’t have pre-built charts that limit creativity. Instead, it has tools that make the connection between data and graphics easy. It sits right between the two, the perfect place for a library meant for data visualization.
Looking to create more data-driven content? Check out our whitepaper, Data Driven Content Marketing.
Or, take a look at what else we’re doing with data:
- The World’s 50 Most Influential CMOs of 2015
- The 2016 CES Influence Report
- The 2016 Grammy Awards Influence Report
Drew Skau is Visualization Architect at Visual.ly and a PhD Computer Science Visualization student at UNCC with an undergraduate degree in Architecture. You can follow him on twitter @SeeingStructure
Frequently Asked Questions
What makes D3.js different from other data visualization libraries?
D3.js works directly in web browsers without requiring plugins, unlike predecessors like Prefuse and Flare. It manipulates the entire document object model, offering unlimited flexibility compared to canvas-only libraries like Processing.js or Paper.js. This seamless integration with HTML, CSS, and SVG means visualizations can appear anywhere on a webpage and look exactly as designed.
How has D3.js influenced modern data storytelling?
D3 has become integral to digital journalism, powering interactive stories at Reuters and The New York Times. Recent projects from 2023-2024 show experimental work blending art with data visualization. The library enables tight integration between visuals and underlying data, making it essential for compelling data-driven narratives that go beyond simple charts.
Why do educators choose D3.js for teaching data visualization?
Professors adopt D3 because it forces students to understand the fundamental relationship between data and visual shapes. The library appears in over a dozen university curriculums, with examples constantly shared on GitHub and Observable. This hands-on approach creates a natural learning momentum where students become engaged through experimentation and iteration.
What are the main performance limitations of D3.js?
D3 struggles with large datasets because DOM manipulation becomes extremely slow with numerous entries. SVG rendering also hits performance walls when handling thousands of elements simultaneously. However, effective data visualization rarely requires displaying massive quantities of elements on screen, making these limitations manageable for most practical applications.

Read more
-
Marketing
From Meta to Cara: Where Artists Reclaim Their Creative Freedom
What Is Cara? “Cara is a social media and portfolio platform for artists.” Straightforward, right? That’s how they define themselves on Cara’s “about” page. In response to the spread of generative AI, Cara aims to filter out AI-generated images, providing a space where genuine human creativity can be easily found and appreciated. The platform (in […]
-
Marketing
Reddit: Why You Should Keep an Eye on This Ever-Growing Platform
Discover why Reddit is the go-to platform for real-time insights and discussions. With a unique community-driven structure, Reddit offers a space for users to explore diverse topics. Learn how the Google-Reddit deal enhances its influence and what it means for marketers in our in-depth analysis.
-
Marketing
Interactive Product Demo: The Selling Power Behind the Strategy
A good interactive product demo is an impactful way to interest consumers in your best products. Here’s a closer look at what today’s marketers need to know to get them just right.